Hit Tuneup, Statistics
Table of contents
Overview
In this milestone, you will integrate and test all the software you have written on your laser tag unit hardware. No new code is required. If you have any issues with your analog board or laser tag system as a whole, you will need to resolve them now so you can demonstrate your system for pass-off. You will also adjust the hit sensitivity of your laser tag unit and characterize each unit. Adjusting the sensitivity can account for variations in the design and performance of each analog board. This milestone will be accomplished as a team. However, each member of the team needs to fully contribute to the work. You will demonstrate the functionality of your laser tag units and write a statistical report as described further below.
Each group (typically 2 students) will:
- Discover and record the minimum and maximum threshold factor (hit sensitivity) for your tag unit
- Detect only actual shots – no false detects
- Each tag unit may have a different factor depending on the analog board
- Verify functionality using a pair of laser tag units
- Shoot when the trigger is pulled and tag another unit at 40 feet
- Detect a hit reliably at 40 feet with no false hits
- Flash the ‘hit indicator’ red when hit
- Lock out the detection of hits when the ‘hit indicator’ is on
- Shot counter decrements and reloads properly
The team (typically 4 students) will:
- Perform a set of statistical distance experiments
- Compare the performance of each pair of units
- Write a statistical report
M4 Test Program
You will use the M4 test program to perform the tests and experiments needed for this milestone. It uses all of your code developed in class. Therefore, it is useful in making sure all the modules you wrote work well together and perform the necessary tag related functions, such as, making shots and detecting hits at a practical range.
Since this test is intended to operate on battery power without a cable connection to a host computer, it does not print results to the terminal output. All interaction occurs through the display, buttons, and trigger. The display shows several control and status items.
- Control panel:
- Transmit mode (TX):
- on: continuous, useful in focusing the optics
- shot: 200 ms pulse when trigger is pressed
- Channel (CH): transmit channel, 0-9
- Threshold factor (THRESH): hit sensitivity of the detector in powers of 2
- Transmit mode (TX):
- Status panel:
- Hits (HITS): total hits detected (counts up from 0)
- Shots (SHOTS): shots remaining (counts down from 40)
- Histogram: displays the hits received on each channel
The four navigator (NAV) buttons on the laser tag unit interact with the control panel.
- NAV Left: Move control selection left
- NAV Right: Move control selection right
- NAV Up: Increment the selected control option
- NAV Down: Decrement the selected control option
Pressing the trigger will fire a shot. Holding the trigger for 3 seconds will reload the shot count to 40 and reset the hit count to 0. These counts are useful when performing the statistical distance experiments.
When a hit occurs, the NeoPixel LEDs will flash red for 500 ms. If they flash a different color, you will need to fix the pixel color order in hitLedTimer.c.
Before building the M4 test code, first set the MILESTONE variable in ltag/main/CMakeLists.txt to “m4”. Load the M4 test program into flash memory with the idf.py flash command.
The Milestone 4 test program ignores hits on the currently selected transmit channel. Otherwise, the transmit signal feeds back optically and electrically into the receiver causing a hit on your own unit.
Integration and Test
Make sure that your group has two laser tag units with charged batteries and functional analog boards. If you are confident that your laser tag unit hardware is working well from Milestone 1, you can skip to Step 2.
Step 1: Run Diagnostic Program
The diagnostic program does not use your code developed in class, but uses reference code instead. Therefore, it is more useful for detecting hardware issues with your laser tag unit.
- Load the diagnostic program into flash memory using these instructions.
- Set each laser tag unit to a different transmit channel, one to channel 6 and the other to channel 8.
- Point the tag units at each other and hold the trigger to emit a signal on the selected channel.
- View the histogram on the LCD display to see if you are detecting energy on the correct channel.
- Increase and decrease distance between the tag units and watch to see how this affects the histogram display.
It is normal to see some amount of noise, e.g., small amounts of energy on all the channels. However, the energy for the shooter’s transmit signal should be higher than the background noise.
If you don’t see energy showing up on the shooter’s transmit channel, don’t bother trying to run the M4 test. Get the diagnostic test working first. At this point, because you passed off M3T3, you can have more confidence that all of your software works correctly, so the problem is likely one of the following hardware issues:
- The transmitter is not properly generating a square wave signal or a light beam at the desired frequency.
- The receiver is not detecting a light signal through the photo diode.
- A bad analog cable connection. Check that your cables are connected in the proper orientation.
Make sure that your analog board is working correctly. If needed, you can go back and redo the analog board tests using the test setup in the rear of the lab.
Step 2: Sensitivity Test
In this step, you will discover and record the minimum and maximum threshold factor (hit sensitivity) for your tag unit using the M4 test program. Each unit may have different values. Make sure the M4 test program is loaded into flash memory before running the tests.
The hit sensitivity can be adjusted by changing the threshold factor. Just remember that a lower threshold factor will allow hits to be detected more easily, but it will also increase the chance of false hits caused by noise. On the other hand, a higher threshold factor will make the receiving tag unit more immune to false hits caused by noise, but it will lower your overall sensitivity and the potential distance from a shooter that a hit can be detected.
The general idea behind hit detection is that the threshold for a hit tracks the current background noise to some degree. Thus if the frequency channels all have energy values that are a little high, the computed threshold also tracks higher. Vice versa, if the frequency channels all have energy values that are lower, the computed threshold also tracks lower. In practice this strategy works quite well, achieving distances of 100 feet or more.
Some computer displays and laptop screens can radiate light noise at frequencies that correspond with the laser tag unit channels. If you notice stray hits coming in at higher threshold levels, move away from a computer display to make sure it is not the source of the noise.
Minimum Threshold Factor
Even though the transmit channel is ignored, there is enough energy feeding back on other channels to cause a hit at low threshold factors (high sensitivity). The goal of this test is to find the lowest threshold factor that does not detect a self hit when a shot is fired. This setting will give you the longest range on your tag unit, but may occasionally give you false hits. If you set the threshold factor even lower, you will reach a point that background noise will continually cause hits.
- Power-on or reset the unit. The default channel should be 6.
- Highlight the threshold factor control (THRESH) using the NAV Left and Right buttons.
- Press the trigger to fire a shot.
- If a self hit was not shown on the display, repeat decreasing the threshold factor (NAV Down) until firing a shot causes a self hit.
- If a self hit was shown on the display, repeat increasing the threshold factor (NAV Up) until firing a shot does not cause a self hit.
- Record the lowest threshold factor that does not detect a self hit when a shot is fired.
Maximum Threshold Factor
Higher threshold factors reduce the sensitivity of the detector. The goal of this test is to find the highest threshold factor for your unit that can still detect a hit at 40 feet. This is the most noise immune setting for your unit that is still useful for game play. For this test you will need two tag units from your group, one to transmit and the other to receive. The transmitting unit will need to be located 40 feet away from the receiver.
- Power-on or reset both units. The default channel should be 6.
- Set the transmitting unit to channel 8.
- Focus the light beam of the transmitting unit.
- Highlight the threshold factor control (THRESH) using the NAV Left and Right buttons.
- Turn the receiving unit 90 degrees to one side so that the acrylic side panel is facing the transmitting unit.
- Fire a shot from the transmitting unit at the receiver. Try another shot if your aim is off.
- Check that the hit occurs on channel 8.
- If a hit was shown on the display, repeat increasing the threshold factor (NAV Up) until firing a shot does not cause a hit.
- If a hit was not shown on the display, repeat decreasing the threshold factor (NAV Down) until firing a shot causes a hit.
- Record the highest threshold factor that detects a hit when a shot is fired.
Repeat the test with the other tag unit now as the receiver. In the end, all tag units will need to be characterized by this sensitivity test.
The receiving lens on the front of your tag unit is more sensitive to a shot coming straight from the front. The sensitivity is less for a shot coming from the side. By turning the unit 90 degrees to the side in the threshold test, it ensures that the determined threshold factor can detect side shots.
If your tag unit is not behaving as expected, go back to Step 1 and run the diagnostic program.
Statistical Distance Experiments
As a team, you will perform a set of statistical distance experiments as described below. Also, as a team you will write a statistical report that describes the results and conclusions from your experiments.
Create shooter data by making shooting attempts at 20’, 40’, and 60’ using each group’s laser tag units in your team. Typically, this would involve using Group X’s pair of tag units to collect one set of data, and using Group Y’s units for another set of data. Compute the statistics as discussed below for each group’s laser tag units. Compare the statistics for each group. Is one group’s laser tag units clearly better than another under all situations?
Overview
By now, you have seen that many engineering problems can be modeled with random variables. For example, you learned in ECEN 240 that Ohm’s law dictates the exact voltage drop V across a resistor as a function of the current across the resistor I and the resistor’s resistance value R. That relationship is now familiar to you, and can be expressed as:
Yet, if you were to measure the resistance, the current, and the voltage, you probably wouldn’t be surprised to see a small deviation in the resulting relationship between the three measurements. In other words, you might actually observe:
for some small, but nonzero, value of epsilon.
Often these small differences occur from the inaccuracy of our measurements, and often they occur due to small differences in the environments or small defects in the materials. The combination of several of these small effects can easily be modeled by letting epsilon be a random variable with a certain distribution defined over its range of values. The Gaussian distribution tends to model several natural phenomena, resulting in its importance in statistical analysis. In many engineering applications, we want actual measurements to inform our understanding of the distribution of epsilon. Is it really Gaussian? What are the mean and variance of the distribution? Statistics can help us answer these questions.
Now, let’s apply this principle to your overall laser tag system. Although you have verified that your system “works” at 40 feet, we might naturally ask a follow on question: “How well does it work?” To answer this question, the principles of STAT 201 can help us form a meaningful statistical analysis. In other words, we will let W be a random variable with its distribution defined as:
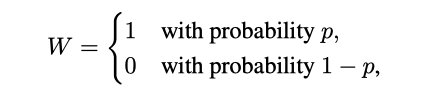
where W = 1 indicates that your receiving laser tag unit detects a ‘hit,’ and W = 0 indicates that it misses a detection. (This type of random variable is known as a Bernoulli random variable, and you probably recognize it as one of the simplest ways to model outcomes of a random experiment.) A hit may miss detection for a number of reasons. You should brainstorm several reasons why these occur while you conduct this experiment.
Objective
The purpose of this experiment is to apply probabilistic and statistical tools from STAT 201 to help you understand the reliability of your laser tag system (and your aim). Each person will need a working tag unit for this experiment.
Procedure
- Make sure that the M4 test program is loaded in flash memory.
- Reload your shot count and clear the hit count by holding the trigger for 3 seconds.
- Select one laser tag unit in the group to be your receiver and the other unit to be your transmitter. For each group, you do not need to switch transmit and receive roles and run the experiment again. Only one way is needed in this experiment.
- Focus the light beam of the transmitting unit.
- Set the threshold factor of the receiving unit down two increments from the maximum determined in the sensitivity test. For example, if your maximum threshold factor was 8192, you would set the threshold factor to 2048.
- Turn the receiving unit 90 degrees to one side so that the acrylic side panel is facing the transmitting unit.
- Test your system n=40 times at each of the three distances: 20 ft, 40 ft, and 60 ft. Then, use your data to estimate probabilities of detection p20, p40, and p60, where the subscript indicates the distance between the transmitter and receiver for your laser tag system.
- Does it make sense that these probabilities will be different? Hypothesize the relationships between these probabilities before you begin. That is, which one will be the largest, which one will be the smallest, and by about how much will they differ? How well do your estimates match your hypotheses?
- As you may recall from STAT 201, the maximum likelihood estimate of a probability is simply the ratio of successful trials to the number of total experiments.
- Calculate the 95% confidence intervals for each of your estimated probabilities.
- Remember from STAT 201, if all of you were to run the same experiment to estimate a probability p, and then calculate confidence intervals at the 95% level for your estimate, we would expect 95% of you, on average, to actually bound the true value of p within your upper and lower bounds of the confidence interval. See Section 5.2 (pp. 338-344) of your STAT 201 textbook for a reference. Given a desired width of your confidence interval, and no knowledge of p, Example 5.14 may be useful in determining the value of n you require. Use a 95% confidence interval for your calculations.
- Notice that the width (difference between upper and lower bounds) of the confidence interval shrinks as n grows. This matches our intuition that more data will result in better estimates.
- Produce a table summarizing your results. Include the value of n, the number of successful trials at each distance, your estimates of the probabilities p20, p40, and p60, and the 95% confidence intervals for each estimate.
- Compare the confidence intervals from each group within your team. Answer these questions:
- Is one group’s units better for all distances?
- Or, is distance the main determining factor, e.g., are one group’s units better at 40 feet and the other’s better at 60 feet?
The assumptions made when using a common formula for confidence intervals are unreliable when the sample size is small or the estimated probability of success (p-hat) is close to zero or one. So in these cases, you may see some intervals slightly less than zero or greater than one. For the purposes of the statistical report, we will accept the error in these assumptions. See Binomial proportion confidence interval.
Pass Off
Function Demonstration
Each group within your team should demonstrate the following to a TA. All tests except for number 6 can be done at close range. You may need to adjust the threshold factor on your tag unit. Two increments down from the maximum determined in the sensitivity test is a good starting point. Set one unit to transmit on channel 6 and the other on channel 8.
- Aim Unit 1 with the shot LED pointing at the photo receiver of Unit 2
- Pull the trigger on Unit 1
- Show that a hit is shown on the display of Unit 2
- Show that the ‘hit indicator’ flashes red on Unit 2
- Verify that Unit 2 cannot be hit by an opponent when the ‘hit indicator’ is on
- Verify that hits can be reliably detected when the laser tag units are at least 40 feet apart
- Demonstrate that there are no false positives
- Point Unit 2 at the room lights and demonstrate that no hits are detected
- Point Unit 1 so that a shot will miss Unit 2
- Pull the trigger on Unit 1 and make sure that a hit is not detected
Repeat the process with the other unit.
Points will be deducted from an individual’s score for the following issues:
- 25 points - tag unit does not detect hits at 40 feet.
- 25 points - shot LED is dim and does not hit another unit at 40 feet.
- 10 points - hit indicator does not flash red for half second interval.
- 10 points - a hit is received when the hit indicator is on.
- 10 points - a false hit is received.
- 10 points - shot counter does not decrement once for each pull of trigger.
- 10 points - shot counter does not reset after holding trigger for 3 seconds.
M4 Statistical Report
Produce a short report that includes:
- Summary of the design and results of your experiments.
- List of maximum and minimum threshold factors for each laser tag unit.
- Key equations and calculations.
- Table summarizing your results.
- List of several factors that may be leading to the randomness of your outcomes.
- Conclusions on your experiments.
- Description of how you would market the range of your laser tag system (as if you were trying to sell this product).
Submit only one file per team. All team members will receive credit.