Table of Contents
You will use the Vivado simulator a lot during your labs and the efficiency with which you complete labs and debug your circuits will be based in a large part on your ability to use the simulator effectively. This tutorial provides a few brief tips that will help you use the simulator more effectively.
Default Waveform Signals
When you first start the simulator, the waveform viewer will add all of the ports, internal signals, parameters, and local parameters from the top-level module in the waveform. In many cases, it will add more items in the waveform than you want to watch (too many signals will clutter your waveform viewer). You can delete any signals you do not want to watch by selecting the signal, right-clicking, and select delete.
In most cases, you are going to have a testbench as the top-level design and you usually don’t care much about the signals in the testbench. Instead, you want to see the signals in your module (sometimes called the design under test or DUT). You will need to manually add the signals from your module to the waveform viewer to watch them. To add waveforms from your module to the waveform editor, perform the following steps:
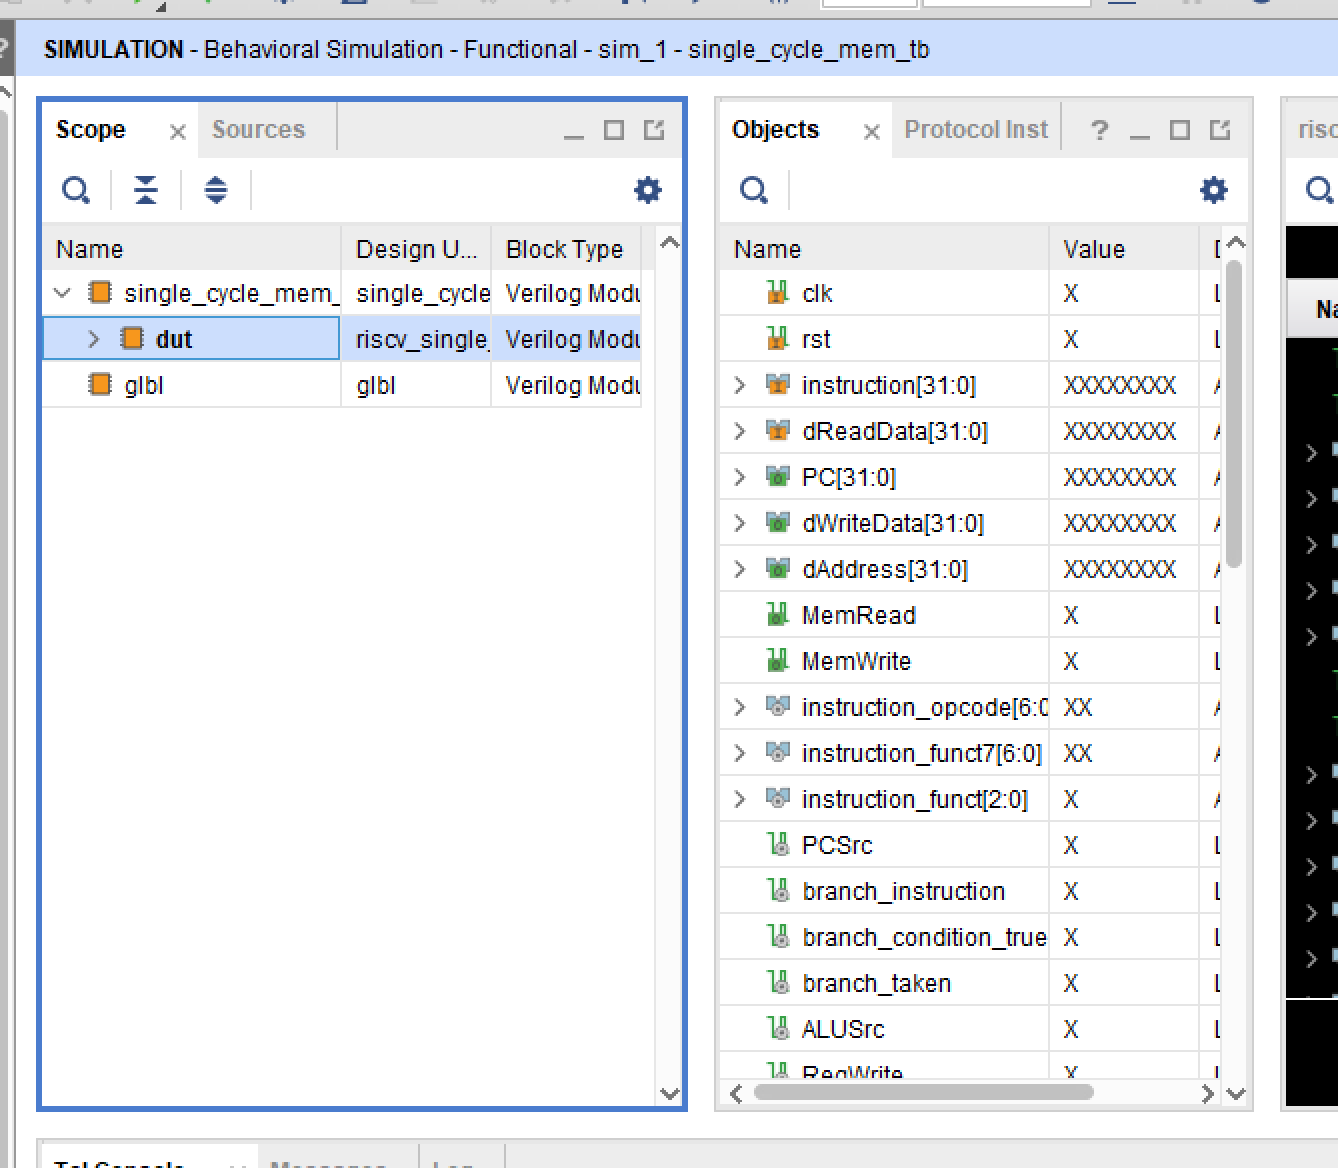
- Select your module in the “scopes” tab in the simulation window. When you select your module, the signals listed in the “Objects” tab will reflect the signals in your module rather than the signals in the testbench.
- Select the signals from the “Objects” tab from your module that you want to add
- Right-click and choose “Add to Wave Window”
This will add the signals from your module to the waveform window (see figure below).
Organizing Signals in the Waveform Viewer
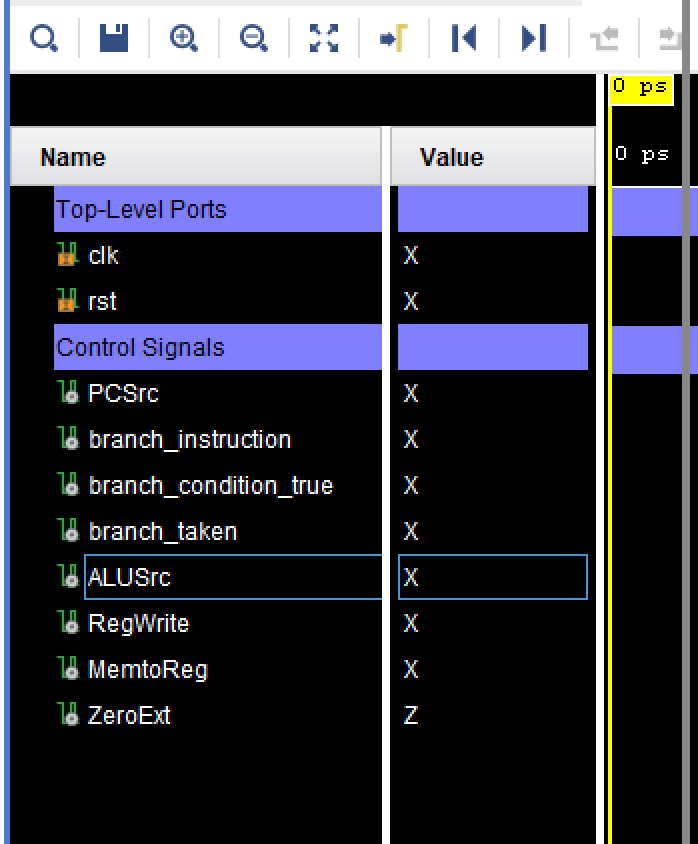
During the semester you will be simulating a large number of signals and it will be challenging to manage your waveform viewer. There are a number of things you can do to organize your waveform viewer and make it easier for you to view and debug your circuit. One feature is the ability to put “Dividers” in the waveform viewer. Dividers are text boxes placed in the list of signals that allow you to place markers above groups of related signals. To add a divider:
- Right click on waveform viewer
- Select “New Divider”
- Type in the name of the divider into the text box
The example below demonstrates the use of two dividers.
You will want to move the signals around in the waveform to group related signals together. You can move a signal to a different location in the waveform list by selecting and dragging it up or down to desired location.
“Go To” Time in Waveform Viewer
Most of the testbenches used in the class will provide text output on the console. These messages often have timestamps to indicate something important happening at a specific time (such as an error). These text messages are often easier to follow than the mess of signals that you see in the waveform viewer. The following example demonstrates some output from the simulation console:
[900ns] 0x00400080:  beq x0,x0,-12
[910ns] 0x00400074:  add x19,x19,x19
[920ns] 0x00400078:  addi x20,x20,-1
[930ns] 0x0040007c:  beq x20,x0,8
Based on what you see in the console, you may need to go to a specific time in the waveform viewer to see what is going on with more detail. You can move the waveform cursor (the yellow line) to a specific location in the waveform viewer to view all signals at this moment in time.
- Right click in the waveform window (not in the signal name portion of the window)
- Select “Go To …”
- A new text box opens up above the waveform window allowing you to type in a specific time.
- Enter the time you want to go to (ex: 920ns) and hit enter (see note below) Once you have entered this time, the cursor will move to this time and you can review the values of the signals at this time.
NOTE: There seems to be a bug in Vivado 2019.2 in which it does not correctly interpret your time and time units. If you are having this problem, then use “ps” (picoseconds) instead of “ns”. In the example above, you would enter “920ps” instead of “920ns” to figure out what is going on at 920ns in the simulation.
Clearing the console text
The testbenches used in these labs will generate a lot of output and the output from multiple simulations will collect as you simulate. Sometimes you will want to clear the console so you start out with a fresh clean window. This will allow you to capture the text for one specific simulation run. To clear the TCL simulation console, click the garbage can icon in the TCL console simulation tab (see figure below). A window will prompt you for clearing the console.
![]()
Detaching the Waveform Window
The waveform window can be crunched in your simulator window making it difficult to review a large number of signals over a long time period. You can “detach” the waveform viewer from the simulation window to allow you to maximize or increase the size of the waveform viewer during debugging. The window can be detached by clicking on the “detach” icon on the top-left of the waveform window (see image below).

Waveform Configuration Files
It will take some effort to create waveform configurations that suite your debugging needs. You can save the waveform configuration you create and add it to your project. When you do this, the waveform configuration you created will be reloaded the next time you simulate and prevent you from having to enter in a new waveform configuration every time you debug your system. You can save your waveform configuration by clicking on the “disk” save icon in the waveform window. You will also be prompted to save your waveform window when you exit the simulator.
Instead of using waveform configuration files, it is possible to write TCL scripts to automatically add waveforms. There is a tutorial on the 220 wiki for describing how to do this: Adding Waveforms (220 tutorial)