Testbenches are special SystemVerilog files that are used to test your design. These files are non-synthesizable meaning that they are not intended to be converted into a circuit netlist. Their primary purpose is to provide a stimulus to a ‘design-under-test’ (DUT) and check the output to make sure the circuit is operating correctly. This tutorial will guide you through the steps necessary to set up a testbench simulation with the design in Structural Verilog Lab.
The testbench file used for this tutorial is the file lab03\tb_logic_functions.sv from the startercode.
This tutorial will describe how to run the testbench in command line mode and with the Vivado simulation GUI.
Running the Testbench on the Command Line
Simulating with the testbench in command line is very similar to simulating a module using TCL. Follow these steps to simulate your design with this testbench in the terminal:
1. Analyze both your module and the testbench module
Like simulation with Tcl, you need to start by analyzing the files you want to simulate. The testbench file needs to be analyzed as well as the module(s) you are simulating. The following command demonstrates how to analyze both the module and the testbench file:
xvlog logic_functions.sv tb_logic_functions.sv -sv --nolog
Notice that in this example you are analyzing two files with the same command (you can analyze them in separate commands if you like).
2. Elaborate the testbench module
Like simulation with a Tcl file, you need to elaborate the module that you want to simulate.
In this case, we want to elaborate the testbench module.
For this example, the testbench module is named tb_logic_functions located in the file tb_logic_functions.sv.
xelab tb_logic_functions -debug typical --nolog
3. Run the testbench simulation
Once you have a successful elaboration, you can run the simulation of the testbench using the xsim command as follows:
xsim tb_logic_functions --nolog --runall
The --runall flag for ‘xsim’ will cause the simulation to execute a run all ; quit command in the TCL console of the simulator.
This will cause the testbench simulation to execute, print the testbench messages, and then exit.
Carefully review the testbench messages to make sure your circuit does not have any errors.
If your circuit has any errors, fix them until there are no more errors.
Running the Testbench in the GUI
You may need to run the testbench interactively with the GUI if you have errors and need to figure out what is going on. The waveform viewer can be used to look at intermediate signals at different points in time to help you find logic errors. To run the testbench in GUI mode and allow for interactive simulation, execute the following command:
xsim tb_logic_functions -gui --nolog
Note that the --runall flag is not used in this example indicating that rather than running the simulation completely, you can manually run the simulation in the GUI for interactive control.
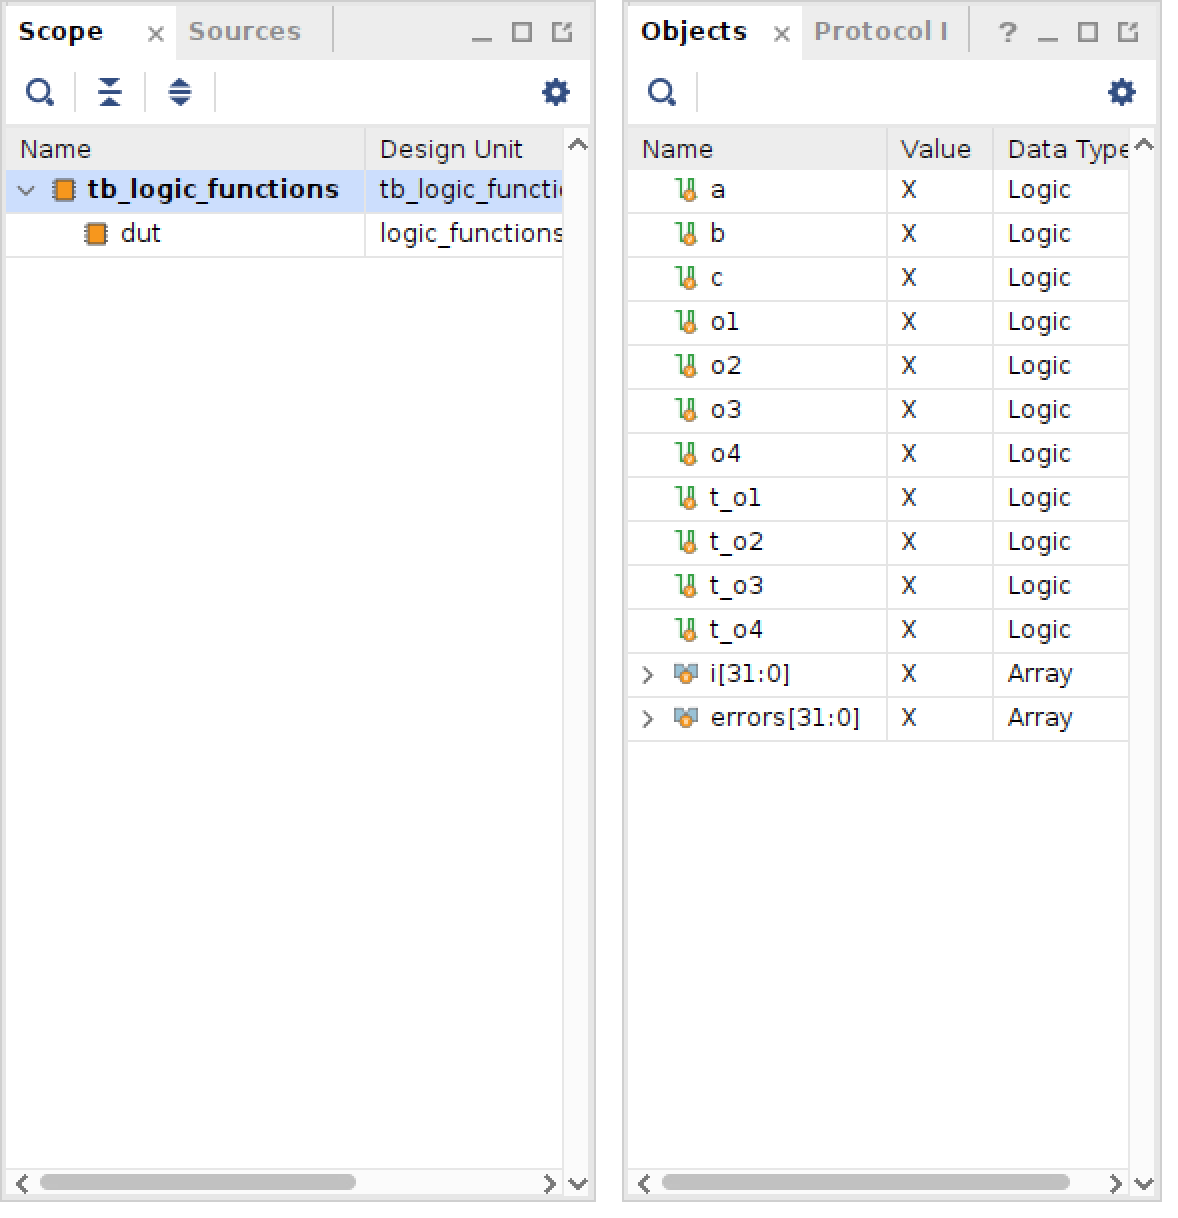
When running this command, you will see the Vivado Simulator GUI open and the ‘Scope’ view will be displayed showing the hierarchy of the simulation (the top-level testbench along with your logic functions underneath).
The hierarchy view will look similar to the following image:

In the image above, the testbench is highlighted and the objects listed in the “Objects” pane are the signals in the testbench. You will want to view the signals in your design rather than the signals in the testbench. To do this, select your design in the ‘scopes’ pane (labelled ‘dut’). Notice that when you select the ‘dut’ that the ‘Objects’ pane will change to show the signals in your design. Right click when hovering over the ‘dut’ and select ‘Add to Wave Window’ to add the signals to the waveform viewer.
Once your signals are in the waveform viewer, you can run the simulation by entering in run commands in the Tcl Console.
Alternatively, you can click on the ‘play’ button in the simulation waveform to advance the simulation the amount indicated in the time window.